
Introduction: Cannabis was legalized in Canada in October 2018, regulating the
production, distribution, sale, and possession of dried cannabis and cannabis oils.
Additional products were legalized 1 year later, including edibles, concentrates,
and topicals, with new lines of commercial products coming to market. Ontario is
the most populous province in Canada and has the largest cannabis market with
the highest number of in-person retail stores and the most cannabis products
available online. This study aims to create a profile of products available to
consumers three years after legalization by summarizing types of products, THC
and CBD potency, plant type, and prices of product sub-categories.
Methods: We extracted data from the website of the Ontario Cannabis Store
(OCS)—the public agency overseeing the only online store and sole wholesaler
to all authorized in-person stores—in the first quarter of 2022 (January 19–March
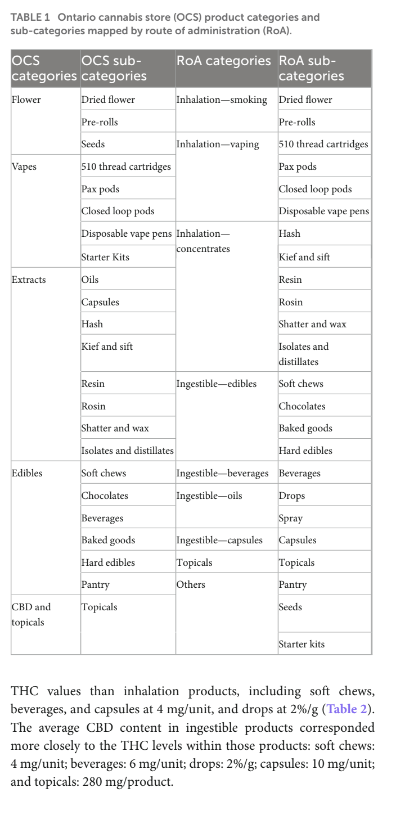
23). We used descriptive analyses to summarize the data. A total of 1,771 available
products were mapped by route of administration into inhalation (smoking,
vaping, and concentrates), ingestible (edibles, beverages, oils, and capsules) and topical.
Results: Most inhalation products included ≥20%/g THC (dried flower: 94%;
cartridges: 96%; resin: 100%) while ingestible products had similar proportions of
THC and CBD content. Indica-dominant products tend to be more prominent in
inhalation products while sativa-dominant products tend to be more prominent
in ingestible products. The average sale price of cannabis was 9.30 $/g for dried
flower, 5.79 $/0.1g for cartridges, 54.82 $/g for resin, 3.21 $/unit for soft chews,
1.37 $/ml for drops, 1.52 $/unit for capsules, and 39.94 $/product for topicals.
Discussion: In summary, a wide variety of cannabis products were available to
Ontarians for different routes of administration and provides numerous Indica-dominant, Sativa-dominant, and hybrid/blend options. The current market for inhalation products however is geared towards the commercialization of high-THC products.
KEYWORDS
cannabis legalization, legal market, adult consumers, cannabis products, cannabis prices,
cannabis potency, THC, CBD
Introduction
Canada was the second nation globally to legally regulate the
production, distribution, sale, and possession of dried cannabis
and cannabis oils in October of 2018 (1). A “second wave” of
legalization came into effect in October 2019, regulating edibles,
high-potency concentrates, and topicals (2), with new lines of
commercial products available by early 2020. One of the main goals
of legalization was to provide safe, legal access to cannabis products
(3), enabling the legal industry to compete with the illegal market.
The legalization of non-medical cannabis in Canada occurred
under the Cannabis Act, which regulates cannabis nationally, but
under Canada’s constitutional division of powers, each of the 10
provinces and 3 territories developed their own laws and regulatory
systems (1). Ontario, Canada’s most populous province and largest
cannabis market follows a hybrid model where a public agency is
the sole wholesaler to all authorized in-person stores—all of which
are private—and also provide direct access to the public through
the only online store.
Purchasing behaviors of consumers are influenced by cannabis
prices and availability in the illegal and legal markets (4). In the
US, cannabis use is higher in states that have legalized cannabis,
with dried cannabis being the most dominant form (5). It is too
early to determine the impact of legalization in Canada as the legal
market continues to evolve, but early evidence suggests increased
use in adults, mixed effects in adolescent use and on driving under
the influence of cannabis, increases in pediatric emergency room
visits and hospitalizations, and decreases in arrests and convictions
(6–13). Given the acute and long-term health risks associated with
cannabis containing high levels of THC (14–17), documenting the
potency of the cannabis products available in the legal market is of
interest to public health.
One year post-legalization, a Canadian study found that the top
10% of cannabis users (those with the highest cumulative cannabis
use) accounted for about two-thirds of cannabis consumption, with
40% of the cannabis consumed in the form of flower products (18).
At that time, legal cannabis sales covered about 33% of Canada’s
cannabis consumption (19). Two years post-legalization, there were
a total of 1,183 legal cannabis stores in Canada (20). Three years
post-legalization, Ontario had the highest number of in-person
retail stores (n = 1,974) and the highest number of products
available online (n = 1,685) among all the provinces and territories
(21, 22). The legal market has expanded to an estimated 57% of
sales as of the last quarter of 2021, making progressive gains in the
displacement of the illegal market (23).
Our aim was to create a profile of the products available
to adult consumers in Ontario—just over three years
post-legalization—and report their THC and CBD potency,
plant type (e.g., indica-dominant, sativa-dominant, hybrid), and
price. To do so, we cataloged products listed on the website of the
Ontario Cannabis Store (OCS), the public agency overseeing the
only online store and sole wholesaler to all authorized in-person
stores. We do not present sales data which are available elsewhere
for approximately the same period (23).
Materials and methods
This is a cross-sectional study designed to produce a profile of
the legal cannabis market in Ontario three years post-legalization.
We extracted data from the OCS website to document the THC
and CBD potency, plant type, and price of all products available
to purchase by Ontario consumers over a span of two months
(19 January–23 March 2022) (22). During data extraction, FT and
YL manually entered information from each cannabis product
into an Excel spreadsheet. Any unavailable or unlisted information
was marked as “N/A”. We used descriptive statistics [counts,
means (M), standard deviations (SD), and ranges] using Excel
functions. FT used pivot tables, sorted columns alphabetically,
and counted each product individually to determine counts
of high potency products and plant types. We also mapped
the product categories and subcategories provided in the OCS
website by route of administration to provide a more meaningful
consumer perspective.
Products on the OCS website are listed with a range of values
for both THC and CBD content (in%/g or mg/unit), rather than
a single THC or CBD value as it is presented on the label
of the individual product purchased by consumers. By design,
regulations placed THC limits per package on ingestible products
(e.g., maximum of 10 mg of THC per package for edibles).
Thus, we calculated the average for each product THC and CBD
range and then averaged the THC and CBD potencies of all
products by their sub-category. Also, the OCS labels products
that contain 20%/g or greater THC as “very strong THC” levels
(OCS (22)). We calculated the frequency and proportion of very
strong THC products using the unit%/g from each product.
As the OCS does not define “very strong CBD” levels, we
labeled any product with an average value above 5%/g as very
strong CBD. We then calculated the number of very strong
THC and CBD products by product sub-category using pivot
tables, alphabetical sorting, and manual counting. For plant type,
we sorted alphabetically and manually counted all the products
categorized as blend, hybrid, indicadominant, or sativadominant
for each of the sub-categories.
In terms of price, a single product often had multiple selling
prices listed depending on the quantity available for purchase, so
we calculated the average of the lowest and highest selling price for
each product and then calculated the average price for each sub-
category (in $/g, $/0.1g, $/ml, or $/unit). In addition, we calculated
the minimum selling price and the maximum selling price for each
sub-category. These average selling prices allow us to approximate
an estimate of how much money a consumer would spend to
purchase a particular product in bulk.
Our study cataloged all the products available in the OCS
during the period of observation and most dried flower products
were only available in one or two quantities while pre-roll
products were available in 20 different quantities (ranging from
0.25 to 30g), making it difficult to report average prices for pre-
determined quantities as previous studies have done (24–27). Thus,
the lowest and highest price per gram of every product was
used for clarity.
The top 10 cannabis products by units sold in Ontario retail
stores were listed in the OCS’s January to March 2022 quarterly
review (23). We used our Excel spreadsheet with the data extracted
from the OCS website to provide more information about each
of these ten products, including THC and CBD potency, plant
type, and price.
Results
Product types and routes of
administration
We mapped a total of 1,771 available products by route of
administration into inhalation (smoking, vaping, and concentrates:
n = 1,250), ingestible (edibles, beverages, oils, and capsules:
n = 410), topical (n = 75), and other (pantry, seeds, and starter kits:
n = 36) (Tables 1, 2). The sub-categories with the most products
under each of the nine categories were: dried flower (n = 508),
thread cartridges (n = 230), resin (n = 50), soft chews (n = 104),
beverages (n = 106), oils-drops (n = 80), capsules (n = 39), and
topicals (n = 75) (Table 2).
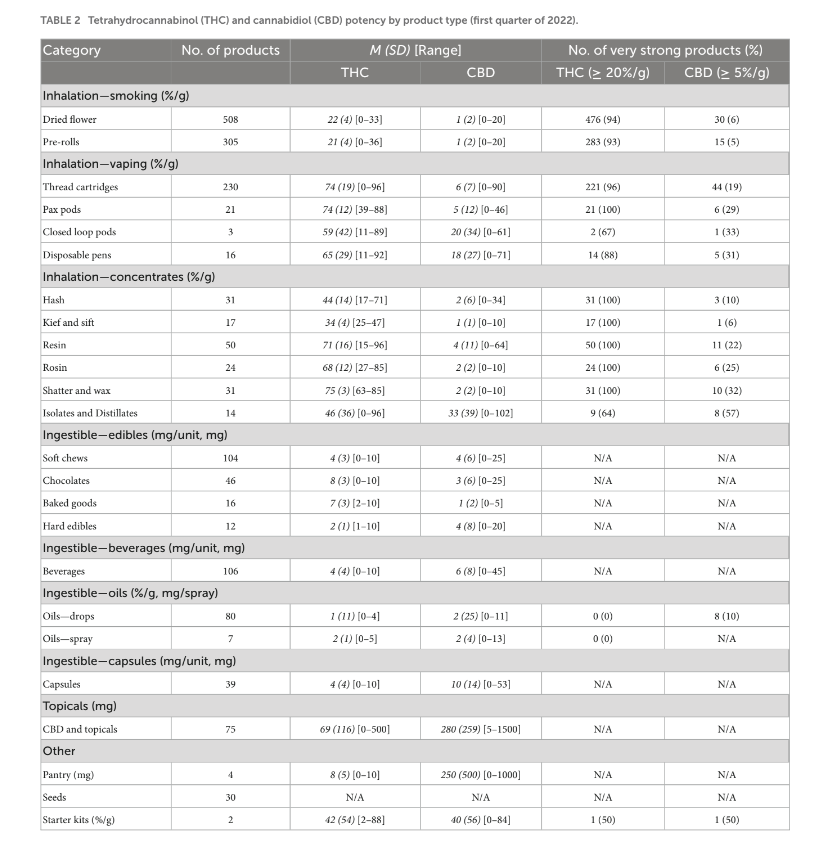
THC and CBD potency
A large proportion of inhalation products were categorized as
very strong THC products (percent of products with ≥20%/g THC
and average THC): dried flower: 94%, 22%/g; thread cartridges:
96%, 74%/g; resin: 100%, 71%/g (Table 2). The trend of high-
THC products continued across the inhalation sub-categories, with
all sub-categories having over 64% of products being classified as
having very strong THC levels and 100% for most concentrates and
some vaping products. Apart from isolates and distillates and closed
loop pods, all sub-categories had very strong levels of THC in over
88% of products. On the other hand, only 6% of dried flowers and 5%
of pre-rolls had CBD levels ≥5%/g. Except for isolates & distillates,
all sub-categories had lower than 33% of products with very strong
CBD levels. Topical products averaged 69 mg/product with a range
of 0–500 mg.
No ingestible products exceeded the regulatory limit of THC
per package (28). As such, ingestible products saw a lower average
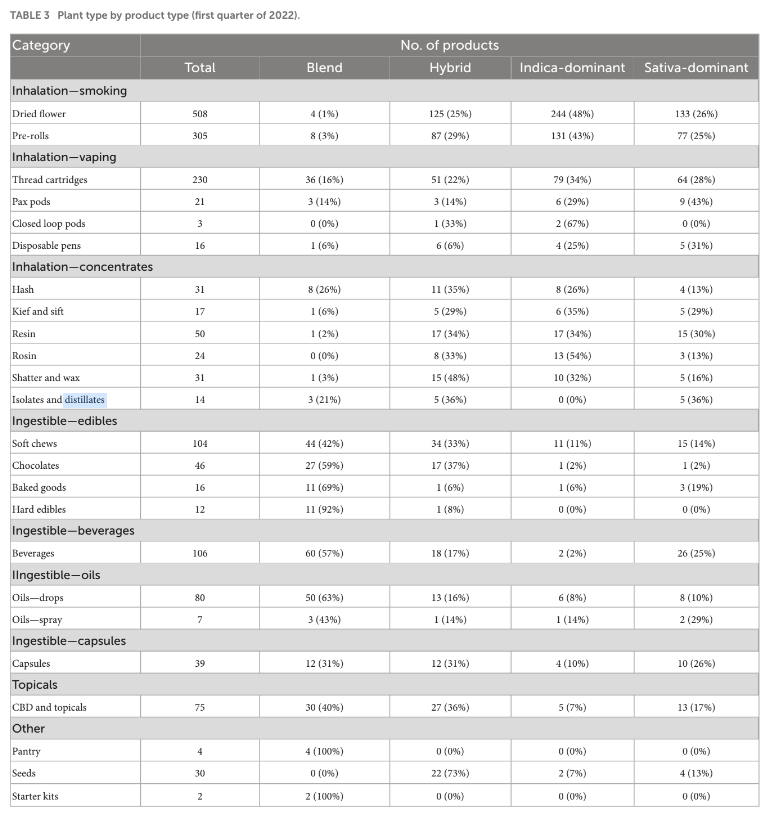
Plant type
The vast majority of products provided information on the
plant type (i.e., blend, hybrid, indica-dominant, sativa-dominant)
(Table 3); this information was missing for only 10 products
(0.56%).
Relative to ingestible products, inhalation products tended to
have a higher percentage of indica-dominant than sativa-dominant
products (dried flower: 48% vs. 26%, cartridges: 34% vs. 28%, resin:
34% vs. 30%) while the opposite was true for ingestible products
(soft chews: 11% vs. 14%, beverages: 2% vs. 25%, drops: 8% vs. 10%,
capsules: 10% vs. 26%, and topicals: 7% vs. 17%).
Ingestible products had more hybrid and blend products
available relative to inhalation products, with the majority of the
ingestible sub-categories carrying mainly blend or hybrid products.
All edibles sub-categories classified over 75% of products as either
hybrid or blend, with less than 25% being classified as indica- or
sativa-dominant.
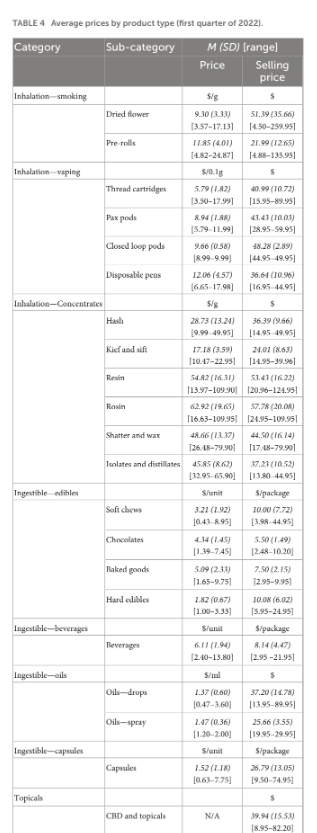
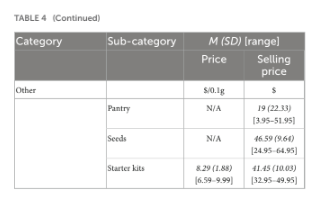
Price
Typically, products were available at a lower selling price when
purchasing higher amounts (Table 4). This enables consumers
to buy more cannabis for a lower price per gram. For example,
if a product’s lowest selling price was $39.95 for 4 g and its
highest selling price was $129.95 for 14 g, the lowest price
in $/g would be $9.99 for 4 g and $9.28 for 14 g. The
consumer has the option to save $0.71/g by buying more
cannabis. This was true in the vast majority of cases, but not in
all cases.
The average selling price of cannabis products was $51.39
(4.50–259.95) for dried flower, $40.99 (15.95–89.95) for cartridges,
$53.43 (20.96–124.95) for resin, $10.00/package (3.98–44.95) for
soft chews, $37.20 (13.95–89.95) for drops, $26.79/package (9.50–
74.95) for capsules, and $39.94 (8.95–82.20) for topicals.
The average price per unit of cannabis for the most
numerous sub-categories was found to be 9.30 $/g (3.57–17.13)
for dried flower, 5.79 $/0.1g (3.50–17.99) for cartridges, 54.82
$/g (13.97–109.90) for resin, 3.21 $/unit (0.43–8.95) for soft
chews, 1.37 $/ml (0.47–3.60) for drops, and 1.52 $/unit (0.63–
7.75) for capsules.
Many products in the flower and pre-roll sub-categories were
sold at multiple price points due to the variety of quantities
available for purchase. A product in the flower section could
be available in multiple sizes, including 1, 3.5, 5, 7, 10, 11, 14,
15, 28, or 30 g. Similarly, products in the pre-roll section could
be available in 0.25, 0.3, 0.32, 0.33, 0.35, 0.4, 0.42, 0.5, 0.6, 0.7,
or 1 g. For each of these sizes, a different number of pre-rolls
may be available, ranging from 1 to 70. Thus, one product
could have multiple price points due to being available in a
variety of quantities.
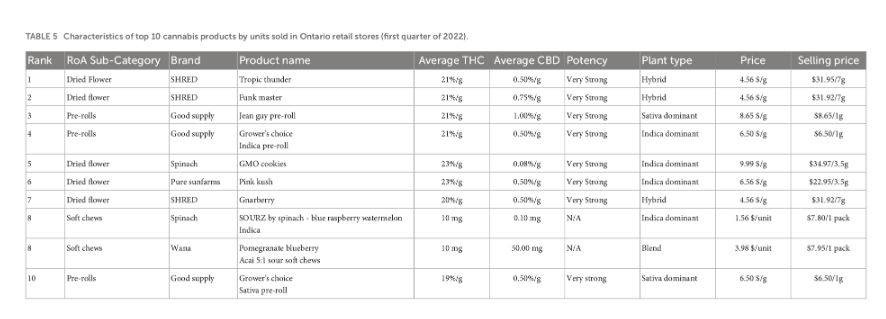
Top 10 cannabis products by units sold
In the first quarter of 2022, the top ten cannabis products by
units sold in Ontario retail stores were mainly inhalation products
(Table 5). Eight of the 10 products fall under the dried flower
(n = 5) and pre-roll (n = 3) sub-categories. Two of the top 10
products sold were ingestible and fall under the soft chews sub-
category. All inhalation products had “very strong” THC levels
with an average of 21%/g. Inhalation products had an average
price of 6.49 $/g while ingestible products had an average price of
2.77 $/unit.
Discussion
This study describes the Ontario cannabis legal market three
years after legalization by cataloging every cannabis product on
offer to consumers rather than profiling a market based on a
subset or a random selection of products. There was a large
variety of products on offer to Ontario consumers with inhalation
products being 2.5 times more numerous than ingestible products.
The majority of inhalation products had very strong levels of
THC. They also had a higher percentage of indica- than sativa-
dominant products while ingestible products saw the opposite
trend. The average price per unit of dried cannabis was $9.30/g,
which is lower than self-reported data collected prior to legalization
(29, 30).
Product variety included varying routes of administration,
with 46% of items classified as smoking products, 16% as vaping,
∼10% each for edibles and concentrates, and between 2 and 6%
each for beverages, oils, capsules, and topicals. The breakdown
of product types resembled that for total sales during the same
time period, which was 50% for dried flower, 18% pre-rolls, 16%
vapes, 5% each of edibles and concentrates, and 2% each of oils
and beverages (23). We also found that eight out of the top ten
products sold in retail stores were smoking products. In the 3
years post-legalization, consumer preferences for particular types
of cannabis products have shifted, although smoking continues
to be the most common route of administration (31). From
2017 to 2022, the Canadian Cannabis Survey—a national survey
implemented by the Government of Canada to monitor the effects
of legalization—reported a decrease in smoking (94–70%) and
vaping using vaporizers (14–10%), and an increase in vaping
using vape pens (20–31%) and edibles (34–52%) (31, 32). From
2020 to 2022, of those who vaped cannabis, liquid cannabis
oil/concentrate use increased (60–74%) and dried flower use
decreased (65–49%) (31, 33). This shift in consumer preferences
is generally seen as a positive consequence of legalization as
lower-risk cannabis use guidelines recommend avoiding routes of
the administration that involves smoking combusted cannabis products
(15). However, the guidelines also caution consumers about the
risk of ingesting larger than anticipated doses associated with edibles, which have
been linked with increased emergency room visits and hospitalizations,
We observed that the current legal cannabis market for inhalation products is geared toward offering products with high THC potency with a lower availability of balanced THC-CBD or high-CBD options. The average THC potency in the current market is higher than the average potency of 10-13% reported by Health Canada prior to legalization (29), and higher still than the average 6–10% reported in the legal medical market that existed pre-legalization of non-medical cannabis (30). THC potency had already been increasing prior to legalization with a 212% increase from 1995 to 2015 (34). At the time of legalization in late 2018, the average THC potency of legal dried flowers across a sample of legal retail stores in Ontario was 16% (31). As of early 2022, we observed that THC levels in dried cannabis on offer to Ontario consumers has an average of 22%. Consumers should be aware that high-potency cannabis can have detrimental effects on mental health and addiction outcomes (16, 17, 35– 37). Within this context, some have argued for imposing limits on THC in cannabis products, and others propose the use of excise tax based on THC levels to incentivize the use of less potent products (38). It is unknown to what degree THC levels impact consumer product choice; however, in various studies of consumer views on cannabis quality, the potency of cannabis was not mentioned as a marker (31, 39–41). In the latest Canadian Cannabis Survey, strength was ranked last among the factors that influence consumer purchases after price, safe supply, quality, convenience, proximity to the retailer, and ability to purchase from a legal source (31). Public outreach around the safer use of cannabis should consider lower-risk cannabis use guidelines; one of the recommendations of which is the choice of lower-potency cannabis products (15). Given the availability of more potent cannabis, future experimental research into their health effects is needed as there is still uncertainty over whether consumers effectively self-titrate THC doses of higher potency products (42).
Despite strict regulations on testing requirements for cannabinoids and contaminants on cannabis products in the Canadian market, we are not aware of peer-reviewed, independent evaluations of the accuracy of product labels (43, 44). However, US studies have reported inconsistencies in cannabinoid labeling on commercial products (45–47). In addition, it has been shown that consumers have difficulties understanding and applying quantitative cannabinoid labeling and additional work should be devoted to improving the labeling of standard doses across routes of administration (48, 49).
The legal market offered a wide variety of products containing different plant types. Inhalation products had higher percentages of Indica-dominant products relative to all other plant types, while ingestible products had higher percentages of sativa-dominant products. There were many offers of blend or hybrid options available in every product category. The taxonomical classification of cannabis into indica and sativa are mostly based on marketing considerations as they do not exist in nature due to historical cross-breeding and misuse of nomenclature (50, 51). However, cannabis users report differential subjective experiences between indica and sativa-dominant products with greater preference for using indica in the evening while reporting feeling “relaxed, sleepy/tired”
and sativa during the day while reporting feeling “alert/energized”
(52). Overall, offered products appear consistent with consumer
preferences for a variety of indica-dominant, sativa-dominant, and
hybrid/blend products.
Previous studies of cannabis pricing have typically been done
by survey research (24, 25), by selecting a subset of products (e.g.,
most popular, least, and most expensive) (26), or by calculating
the average price of a random sample of products at each pre-
determined purchase quantity (27). These studies have typically
reported on the average price of dried flower and pre-rolls at set
quantities (e.g., the average price at 1, 3.5, 7, 14, and 28 g). In our
study, the average price per gram of dried flower for all products
on offer was found to be $9.30 and the lowest price was $3.41
per gram. Sales during that period suggest that the majority of
consumer purchases were made in the lower price range, with most
of the purchases between $3.00 and 6.50 per gram making up 48%
of in-person purchases and 63% of online purchases (23). Our
calculations suggest that spending more money on larger quantities
would provide consumers with a “better deal,” with the average
selling price of dried flower products being $51.39. In line with 2022
self-reported data, consumers who had used recreational cannabis
within the last 30 days spent an average of $65 ($46–$86) from
legal sources per month, an increase from $55 in 2021 (31, 39).
Participants who used cannabis for medical purposes spent an
average of $75 in the past 30 days (31). For consumers that tend
to spend above $50 a month on cannabis, buying dried flower
products “in bulk” seems to be a reasonable approach for reducing
the cost of cannabis per gram.
The average dried flower prices was lower than those reported
in studies of the retail cannabis market in Canada pre-legalization
and at the time of legalization (29, 30). Prior to legalization,
the average self-reported price-per-gram of cannabis was $9.56,
but this varied depending on the quantity purchased (24). In
comparison to self-reported data collected several months post-
legalization, the average price of legal dried flower has decreased
slightly: 9.82 $/g in late 2018 versus 9.30 $/g in early 2022 (27).
In comparison to self-reported legal cannabis prices in Canada
from 2019, regardless of quantity, the average price of dried flower
in 2022 is also lower, ranging from $23.16/1g to $9.95/3.5 g and
$9.95/27.9 g in 2019 (25). Additionally, it was found that the price
of dried flower from legal sources decreased post-legalization (25),
consistent with our findings.
In a recent qualitative study from Canada, participants spoke of
the benefits associated with the illegal cannabis market, including
lower prices, incentives, discounts, and loyalties (41). The majority
of participants in that study noted that legal cannabis is more
expensive than illegal cannabis and that price was of highest
importance when making purchasing decisions (41). This is in
agreement with the Canadian Cannabis Survey in which 30% of
participants in 2022 ranked price as the number one factor that
influences purchases (31, 39). Users on social media platforms
thought legal products were expensive in comparison to illegal
cannabis and have also expressed concerns with difficulties with
supply shortages in the legal market (53). Cannabis users have
indicated that price, product quality, store location, and the
inconvenience of purchasing from legal sources were key reasons
for buying cannabis from the illicit market (54). However, if the
average price per gram and average selling prices of the legal market
continue to follow downward trends, then more Canadians may
become motivated to purchase from legal sources (54). Recent
Canadian research states that the divergence between legal and
illegal cannabis markets is narrowing (25) and the legal share of the
overall cannabis market is estimated to be 57% (23).
Conclusion
The Ontario legal market has a wide variety of cannabis
products on offer to consumers. There is a wide array of products
available for various consumer preferences in plant type, with
numerous indica-dominant, sativa-dominant, and hybrid/blend
options on offer. In line with lower-risk cannabis use guidelines
(15), consumers would benefit from having access to more lower-
potency, mixed THC-CBD ratios, and CBD-dominant products.
Three years post-legalization, Canadian cannabis consumers have
favorable perceptions of legal cannabis products in comparison to
illegal products, apart from price (40).
Data availability statement
The raw data supporting the conclusions of this article will be
made available by the authors, without undue reservation.
Author contributions
SR and PD conceived, designed, and directed the study. FT
extracted the data with support from YL. FT analyzed the data and
wrote the first draft of the manuscript. SR carried out substantial
edits to the initial draft. All authors reviewed various drafts and
approved the final version of the manuscript.
Funding
SR was supported by an Ontario HIV Treatment Network
Innovator Award.
Conflict of interest
The authors declare that the research was conducted in the
absence of any commercial or financial relationships that could be
construed as a potential conflict of interest.
Publisher’s note
All claims expressed in this article are solely those of the
authors and do not necessarily represent those of their affiliated
organizations, or those of the publisher, the editors and the
reviewers. Any product that may be evaluated in this article, or
claim that may be made by its manufacturer, is not guaranteed or
endorsed by the publisher.
References
- Cannabis Act. Canada Justice Laws Website. (2018). Available online at: https:
//laws-lois.justice.gc.ca/eng/acts/c-24.5/page-1.html (accessed September 9, 2022). - Government of Canada. Regulations Amending the Cannabis Regulations (new
classes of Cannabis): SOR/2019-206. (2019). Available online at: https://canadagazette.
gc.ca/rp-pr/p2/2019/2019-06-26/html/sor-dors206-eng.html (accessed September 9,
2022). - Government of Canada. Health Canada. Government of Canada
Launches Legislative Review of the Cannabis Act. (2022). Available online at:
https://www.canada.ca/en/health-canada/news/2022/09/government-of-canada-
launches-legislative-review-of-the-cannabis-act.html (accessed September 9, 2022).
- Wadsworth E. The Effect of Price and Retail Availability on the use of Illegal and
Legal Non-Medical Cannabis in Canada and the United States. Ph D. thesis. Waterloo,
ON: University of Waterloo (2021). - Goodman S, Wadsworth E, Leos-Toro C, Hammond D. Prevalence
and forms of cannabis use in legal vs. illegal recreational cannabis
markets. Int J Drug Policy. (2020) 76:102658. doi: 10.1016/j.drugpo.2019.1
02658 - Myran D, Imtiaz S, Konikoff L, Douglas L, Elton-Marshall T. Changes in health
harms due to cannabis following legalisation of non-medical cannabis in Canada in
context of cannabis commercialisation: a scoping review. Drug Alcohol Rev. (2022)
42:277–98. doi: 10.1111/dar.13546 - Rubin-Kahana D, Crépault J, Matheson J, Le Foll B. The impact of cannabis
legalization for recreational purposes on youth: a narrative review of the
Canadian experience. Front Psychiatry. (2022) 13:984485. doi: 10.3389/fpsyt.2022.98
4485. - Hall W, Stjepanoviæ D, Leung J. Cannabis Legalisation in Canada: A Brief History,
Policy Rationale, Implementation, and Evidence on Early Impacts. Brisbane, QL: The
University of Queensland (2022). doi: 10.14264/a494332 - Myran D, Pugliese M, Tanuseputro P, Cantor N, Rhodes E, Taljaard M.
The association between recreational cannabis legalization, commercialization and
cannabis-attributable emergency department visits in Ontario, Canada: an interrupted
time-series analysis. Addict Abingdon Engl. (2022) 117:1952–60. doi: 10.1111/add.
15834 - Myran D, Tanuseputro P, Auger N, Konikoff L, Talarico R, Finkelstein Y. Edible
cannabis legalization and unintentional poisonings in children. N Engl J Med. (2022)
387:757–9. doi: 10.1056/NEJMc2207661 - Government of Canada. Police-Reported Crime Statistics in Canada, 2019.
Ottawa, ON: Statistics Canada (2020). - Government of Canada. Police-Reported Crime Statistics in Canada, 2020.
Ottawa, ON: Statistics Canada (2021). - Government of Canada. Police-Reported Crime Statistics in Canada, 2021.
Ottawa, ON: Statistics Canada (2022). - Pierre J. Risks of increasingly potent cannabis: the joint effects of potency and
frequency. Curr Psychiatry. (2017) 16:15–20. - Fischer B, Robinson T, Bullen C, Curran V, Jutras-Aswad D, Medina-Mora M,
et al. Lower-risk cannabis use guidelines (LRCUG) for reducing health harms from
non-medical cannabis use: a comprehensive evidence and recommendations
update. Int J Drug Policy. (2022) 99:103381. doi: 10.1016/j.drugpo.2021.1
03381 - Petrilli K, Ofori S, Hines L, Taylor G, Adams S, Freeman T. Association
of cannabis potency with mental ill health and addiction: a systematic
review. Lancet Psychiatry. (2022) 9:736–50. doi: 10.1016/S2215-0366(22)0
0161-4 - Matheson J, Le Foll B. Cannabis legalization and acute harm from
high potency cannabis products: a narrative review and recommendations for
public health. Front Psychiatry. (2020) 11:591979. doi: 10.3389/fpsyt.2020.59
1979 - Callaghan R, Sanches M, Benny C, Stockwell T, Sherk A, Kish S. Who
consumes most of the cannabis in Canada? Profiles of cannabis consumption by
quantity. Drug Alcohol Depend. (2019) 205:107587. doi: 10.1016/j.drugalcdep.2019.10
7587 - Armstrong M. Legal cannabis market shares during Canada’s first year of
recreational legalisation. Int J Drug Policy. (2021) 88:103028. doi: 10.1016/j.drugpo.
2020.103028 - Myran D, Staykov E, Cantor N, Taljaard M, Quach B, Hawken S, et al. How has
access to legal cannabis changed over time? An analysis of the cannabis retail market in
Canada 2?years following the legalisation of recreational cannabis. Drug Alcohol Rev.
(2021) 41:377–85. doi: 10.1111/dar.13351 - Alcohol and Gaming Commission of Ontario. Status of Current Cannabis Retail
Store Applications. Toronto, ON: Alcohol and Gaming Commission of Ontario (2022). - Ontario Cannabis Store. Cannabis. Toronto, ON: Ontario Cannabis Store
(2022). - Ontario Cannabis Store. Ontario Cannabis Store: A Quarterly Review. Toronto,
ON: Ontario Cannabis Store (2022). - Wadsworth E, Driezen P, Goodman S, Hammond D. Differences in self-
reported cannabis prices across purchase source and quantity purchased among
Canadians. Addict Res Theory. (2019) 28:474–83. doi: 10.1080/16066359.2019.16
89961
- Wadsworth E, Driezen P, Pacula R, Hammond D. Cannabis flower prices and
transitions to legal sources after legalization in Canada, 2019–2020. Drug Alcohol
Depend. (2022) 231:109262. doi: 10.1016/j.drugalcdep.2021.109262 - Mahamad S, Hammond D. Retail price and availability of illicit cannabis
in Canada. Addict Behav. (2019) 90:402–8. doi: 10.1016/j.addbeh.2018.1
2.001 - Mahamad S, Wadsworth E, Rynard V, Goodman S, Hammond D. Availability,
retail price and potency of legal and illegal cannabis in Canada after recreational
cannabis legalisation. Drug Alcohol Rev. (2020) 39:337–46. doi: 10.1111/dar.1
3069 - Government of Canada. Final Regulations: Edible Cannabis, Cannabis Extracts,
Cannabis Topicals. (2019). Available online at: https://www.canada.ca/content/dam/
hc-sc/documents/services/drugs-medication/cannabis/resources/final-regulations-
edible-cannabis-extracts-topical-eng.pdf (accessed September 9, 2022).
- McGilveray I. Pharmacokinetics of cannabinoids. Pain Res Manag. (2005)
10:15A–22A. doi: 10.1155/2005/242516 - Lucas P. Regulating compassion: an overview of Canada’s federal medical
cannabis policy and practice. Harm Reduct J. (2008) 5:5. doi: 10.1186/1477-7
517-5-5 - Health Canada. Canadian Cannabis Survey 2022: Summary. (2022). Available
online at: https://www.canada.ca/en/health-canada/services/drugs-medication/
cannabis/research-data/canadian-cannabis-survey-2022-summary.html (accessed
January 6, 2023). - Health Canada. Canadian Cannabis Survey 2018: Summary. (2018). Available
online at: https://www.canada.ca/en/services/health/publications/drugs-health-
products/canadian-cannabis-survey-2018-summary.html (accessed October 30,
2022).
- Health Canada. Canadian Cannabis Survey 2020: Summary. (2020). Available
online at: https://www.canada.ca/en/health-canada/services/drugs-medication/
cannabis/research-data/canadian-cannabis-survey-2020-summary.html (accessed
October 30, 2022). - Stuyt E. The problem with the current high potency THC marijuana from the
perspective of an addiction psychiatrist. Mo Med. (2018) 115:482–6. - Murray R, Quigley H, Quattrone D, Englund A, Di Forti M. Traditional
marijuana, high-potency cannabis and synthetic cannabinoids: increasing risk for
psychosis. World Psychiatry. (2016) 15:195–204. doi: 10.1002/wps.20341 - Di Forti M, Quattrone D, Freeman T, Tripoli G, Gayer-Anderson C, Quigley
H, et al. The contribution of cannabis use to variation in the incidence of psychotic
disorder across Europe (EU-GEI): a multicentre case-control study. Lancet Psychiatry.
(2019) 6:427–36. doi: 10.1016/S2215-0366(19)30048-3 - Hines L, Freeman T, Gage S, Zammit S, Hickman M, Cannon M, et al.
Association of high-potency cannabis use with mental health and substance use in
adolescence. JAMA Psychiatry. (2020) 77:1044–51. doi: 10.1001/jamapsychiatry.2020.
1035 - Transform Drug Policy Foundation. How to Regulate Cannabis: A Practical
Guide. 3rd ed. Bristol: Transform Drug Policy Foundation (2022). - Health Canada. Canadian Cannabis Survey 2021: Summary. Government
of Canada. (2021). Available online at: https://www.canada.ca/en/health-canada/
services/drugs-medication/cannabis/research-data/canadian-cannabis-survey-2021-
summary.html (accessed October 30, 2022). - Wadsworth E, Fataar F, Goodman S, Smith D, Renard J, Gabrys R, et al.
Consumer perceptions of legal cannabis products in Canada, 2019–2021: a repeat
cross-sectional study. BMC Public Health. (2022) 22:2048. doi: 10.1186/s12889-022-
14492-z - Donnan J, Shogan O, Bishop L, Najafizada M. Drivers of purchase decisions for
cannabis products among consumers in a legalized market: a qualitative study. BMC
Public Health. (2022) 22:368. doi: 10.1186/s12889-021-12399-9 - Leung J, Stjepanoviæ D, Dawson D, Hall W. Do cannabis users reduce their THC
dosages when using more potent cannabis products? A review. Front Psychiatry. (2021)
12:630602. doi: 10.3389/fpsyt.2021.630602 - Government of Canada. Guidance Document: Good Production Practices Guide
for Cannabis. (2019). Available online at: https://www.canada.ca/en/health-canada/
services/cannabis-regulations-licensed-producers/good-production-practices-guide/
guidance-document.html#a5.3 (accessed January 11, 2023). - Botelho D, Boudreau A, Rackov A, Rehman A, Phillips B, Hay C, et al. Analysis of
Illicit and Legal Cannabis Products for a Suite of Chemical and Microbial Contaminants: A Comparative Study. Fredericton, NB: New Brunswick Research and ProductivityCouncil (RPC) (2021). - Gurley B, Murphy T, Gul W, Walker L, ElSohly M. Content versus label claims
in cannabidiol (CBD)-containing products obtained from commercial outlets in the
state of Mississippi. J Diet Suppl. (2020) 17:599–607. doi: 10.1080/19390211.2020.176
6634 - Mazzetti C, Ferri E, Pozzi M, Labra M. Quantification of the content of
cannabidiol in commercially available e-liquids and studies on their thermal and
photo-stability. Sci Rep. (2020) 10:3697. - Miller O, Elder E, Jones K, Gidal B. Analysis of cannabidiol (CBD)
and THC in nonprescription consumer products: implications for patients
and practitioners. Epilepsy Behav. (2022) 127:108514. doi: 10.1016/j.yebeh.2021.1
08514 - Leos-Toro C, Fong G, Meyer S, Hammond D. Cannabis labelling and consumer
understanding of THC levels and serving sizes. Drug Alcohol Depend. (2020)
208:107843. - Hammond D. Communicating THC levels and “dose” to consumers:
implications for product labelling and packaging of cannabis products in
regulated markets. Int J Drug Policy. (2021) 91:102509. doi: 10.1016/j.drugpo.2019.0
7.004 - Micalizzi G, Vento F, Alibrando F, Donnarumma D, Dugo P, Mondello L.
Cannabis sativa l.: a comprehensive review on the analytical methodologies for
cannabinoids and terpenes characterization. J Chromatogr A. (2021) 1637:461864.
doi: 10.1016/j.chroma.2020.461864 - Jin D, Henry P, Shan J, Chen J. Classification of cannabis strains in the Canadian
market with discriminant analysis of principal components using genome-wide single
nucleotide polymorphisms. PLoS One. (2021) 16:e0253387. doi: 10.1371/journal.pone.
0253387 - Sholler D, Moran M, Dolan S, Borodovsky J, Alonso F, Vandrey R, et al. Use
patterns, beliefs, experiences, and behavioral economic demand of indica and sativa
Cannabis: a cross-sectional survey of cannabis users. Exp Clin Psychopharmacol. (2022)
30:575–83. doi: 10.1037/pha0000462 - Aversa J, Jacobson J, Hernandez T, Cleave E, Macdonald M, Dizonno S.
The social media response to the rollout of legalized cannabis retail in Ontario,
Canada. J Retail Consum Serv. (2021) 61:102580. doi: 10.1016/j.jretconser.2021.10
2580 - Goodman S, Wadsworth E, Hammond D. Reasons for purchasing cannabis from
illegal sources in legal markets: findings among cannabis consumers in Canada and
U.S. states, 2019–2020. J Stud Alcohol Drugs. (2022) 83:392–401. doi: 10.15288/jsad.